Summarize your MySQL slow log file with mysqldumpslow
It can be difficult to make sense of the slow query log when investigating MySQL database performance. Fortunately, MySQL comes with a little tool to help you interpret those queries, called mysqldumpslow.
Enable the slow query log
First, let’s enable the Slow Query log without restarting MySQL. Launch the MySQL CLI:
mysql -uuser -p Tell MySQL where you want to store the log file, and make sure the mysql user can write to it:
mysql> SET GLOBAL slow_query_log_file = '/tmp/slow_query.log';Now we determine how many seconds a query is allowed to take before we consider it slow. This example will log every query that takes more than 5 seconds:
mysql> SET GLOBAL long_query_time = 5;If required, you can also log any queries that does not use indexes:
mysql> SET GLOBAL log_queries_not_using_indexes = 'ON';Now that we have configured the slow log, let’s enable it:
mysql> SET GLOBAL slow_query_log = 'ON';
mysql> FLUSH LOGS;
Run sample slow queries
Now let’s get some sample data into the logs. I’m using the SLEEP() and BENCHMARK() functions to create a couple of slow queries:
mysql> SELECT SLEEP(6);
mysql> SELECT SLEEP(6);
mysql> SELECT SLEEP(7);
mysql> SELECT SLEEP(8);
mysql> SELECT SLEEP(7);
mysql> SELECT SLEEP(7);
mysql> SELECT BENCHMARK(99999999, md5('creating a slow query on purpose'));
Use tail -f /tmp/slow_query.log to see the queries being written to the log.
Examine the output
Pass the log file path to mysqldumpslow to get a summary of the slow log:
mysqldumpslow /tmp/slow_query.logIts output looks like this:
Reading mysql slow query log from /tmp/slow_query.log
Count: 1 Time=28.98s (28s) Lock=0.00s (0s) Rows_sent=1.0 (1), Rows_examined=0.0 (0), Rows_affected=0.0 (0), root[root](#)@localhost
SELECT BENCHMARK(N, md5(’S’))Count: 6 Time=6.83s (41s) Lock=0.00s (0s) Rows_sent=1.0 (6), Rows_examined=0.0 (0), Rows_affected=0.0 (0), root[root](#)@localhost
SELECT SLEEP(N)
It groups all similar queries by abstracting the numeric and string arguments into N and S. By default it sorts the queries by their average execution time, from longest to shortest.
Now we can ask even more specific questions about our logs. Let’s ask it which SLEEP() query has been run the most times:
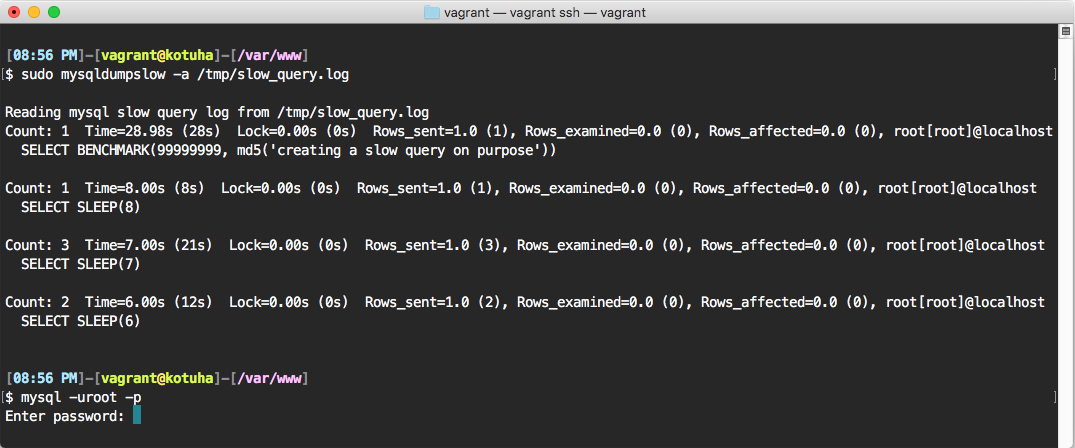
mysqldumpslow -a -g 'SLEEP' -s c -t 1 /tmp/slow_query.logLet’s break these arguments down:
-a: Disable the argument abstraction so we can examine eachSLEEP(x)query separately.-g 'SLEEP': only include queries that match the grep pattern SLEEP.-s c: sort by count, instead of average time.-t 1: display only 1 query.
The result should be the SELECT SLEEP(7); query:
Count: 3 Time=7.00s (21s) Lock=0.00s (0s) Rows_sent=1.0 (3), Rows_examined=0.0 (0), Rows_affected=0.0 (0), root[root](#)@localhost
SELECT SLEEP(7)
Take a look at the man pages to see what else is possible:
man mysqldumpslowThis powerful tool can help you make sense of the slow query logs quickly and easily, and is a great addition to your toolbox.
Don’t forget to disable the slow log again!
mysql> SET GLOBAL slow_query_log = 'OFF';